
Mapping What Lies Beneath: Drone Bathymetry for Ponds, Rivers, and Reservoirs
Sediment builds up quietly. Stormwater ponds lose storage capacity, river channels shift, and reservoirs slowly fill in, yet collecting data from a boat is slow, costly, and difficult in shallow or hard-to-reach water. Terralynx flies a dual-frequency echosounder from a drone to map water depth and estimate sediment, then combines it with LiDAR mapping of the surrounding terrain for a clearer picture above and below the waterline. We handle everything, from flight planning and fieldwork to processing and reporting.
What You Get With Drone Bathymetry Services
-

No Boat, No Wading
Our crew flies the echosounder from a drone, reaching ponds, wetlands, and channels that are unsafe or impractical to reach by boat.
-

One Seamless Model, Bank to Bottom:
Underwater depths and aerial mapping of the shoreline, berms, and structures, merged into a single georeferenced 3D model.
-

River and Channel Cross-Sections:
Channel profiles and cross-sections for hydraulic modelling, erosion monitoring, and flood studies.
-

Depth and Sediment in One Flight:
We capture water depth and soft-sediment thickness on the same pass, showing what has settled, not just how deep the water is.
-

Track Sediment Build-Up:
Year-over-year comparisons show where sediment is accumulating, supporting pond cleanout planning and ongoing monitoring requirements.
-

Data in Familiar Formats:
Point clouds, surfaces, contours, and cross-sections ready for the Civil 3D, AutoCAD, and GIS tools your team already uses.
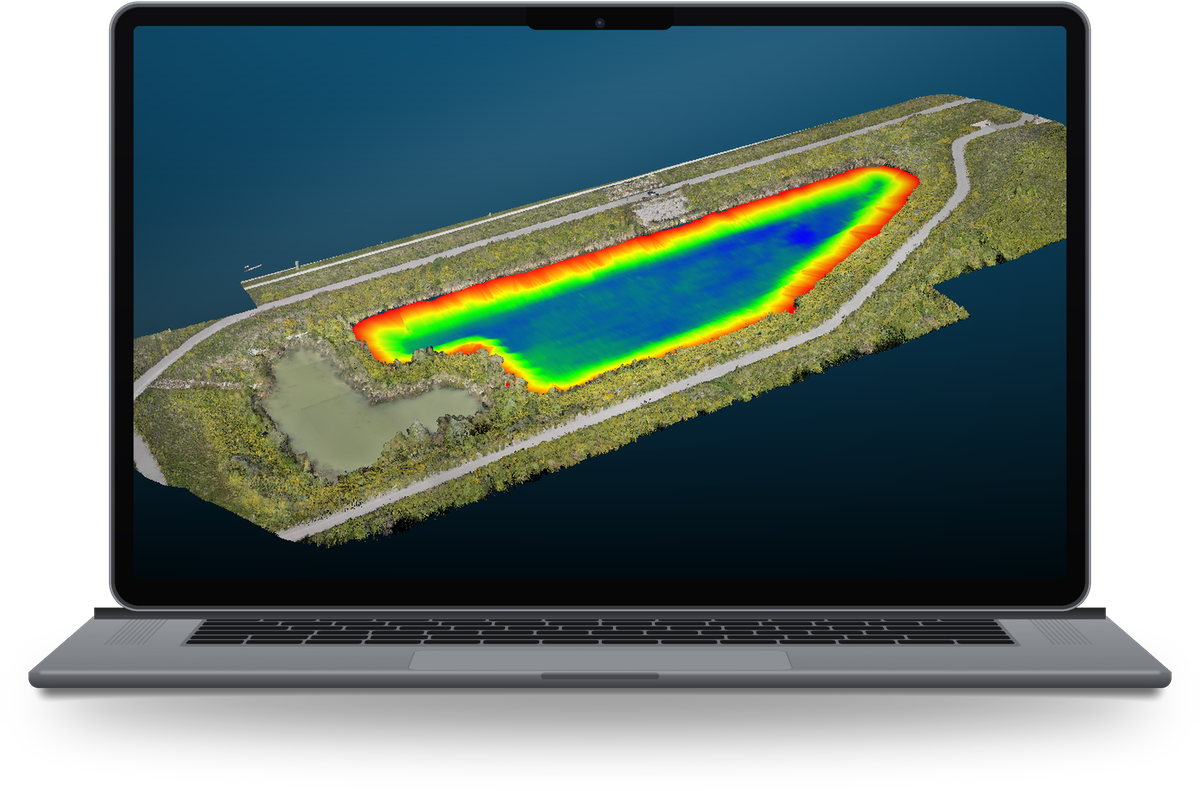
Innisfil depth model: red at the shallow edges, blue at the deepest point (~2.5 m).
Real-World Impact: Case Study
Innisfil Stormwater Pond: A Bank-to-Bottom 3D Model
To demonstrate the service, we mapped a stormwater management pond of roughly 180 m × 50 m (about 8,000 m² of water surface, up to 2.5 m deep) in Innisfil, Ontario. The echosounder, suspended below the drone, recorded depth data across the pond in a single session while aerial mapping captured the surrounding berms, paths, and vegetation. Both datasets were merged into one seamless, georeferenced 3D model showing the basin from the top of the bank to the deepest point.
Mapped the pond floor with no boat, no wading, and no one on the water
Recorded depth and soft-sediment data together using two acoustic frequencies
Produced one continuous surface from bank to basin to support maintenance planning
Mapped 8,000 m² of water surface in just 2 hours on site
Capacity to map up to 1 km of river per day, on channels up to 20 m wide
Our Method: How We Estimate Sediment


1 · 200 kHz narrow beam returns from the top of soft sediment.
2 · 50 kHz wide beam passes through to the firmer bed below.
3 · The gap between the two, mapped across the pond, estimates sediment thickness.
What Is Bathymetry?
Bathymetry is the measurement of water depth and the shape of the ground beneath lakes, rivers, ponds and reservoirs.
A bathymetric map produces a depth model of the submerged surface: contours, cross-sections and a 3D surface referenced to a known datum. Engineers, municipalities and conservation authorities use it to check storage capacity, plan cleanouts and dredging, and feed hydraulic and flood models.
Terralynx collects bathymetry by drone with a dual-frequency echosounder, and maps the surrounding land with LiDAR, so both sides of the waterline arrive in one dataset.
Topography
Elevation of the land surface: banks, berms, fields and structures. Captured with drone LiDAR and aerial mapping.
Bathymetry
Depth and shape of the bed, plus soft-sediment thickness. Captured with a drone-flown echosounder.
One bank-to-bottom model
Both datasets merged into a single georeferenced 3D surface.
Deliverables
Point clouds, surfaces, contours, and cross-sections ready for the Civil 3D, AutoCAD, and GIS tools your team already uses.
Frequently Asked Questions
How is bathymetry measured?
Most inland bathymetry is measured with an echosounder, which times sound pulses to the bottom and back. Terralynx flies a dual-frequency echosounder on a tether below a drone, so ponds and channels can be mapped without a boat or anyone in the water.
How do you measure sediment in a pond?
We use two frequencies. A 200 kHz beam returns from the top of the soft sediment and a 50 kHz beam passes through to the firmer bed. The gap between the two, mapped across the pond, estimates sediment thickness.
What is the difference between bathymetry and topography?
Topography is the elevation of land above the waterline; bathymetry is the depth of the ground below it. Terralynx captures both and merges them into one georeferenced bank-to-bottom model.
How much area can you map in a day?
In Innisfil, Ontario we mapped 8,000 m² of pond surface in 2 hours on site. On rivers we can map up to 1 km per day on channels up to 20 m wide.
What file formats do you deliver?
Point clouds, surfaces, contours and cross-sections in formats ready for Civil 3D, AutoCAD and GIS software.

Start Your Next Project with the Right Data
Founded in 2017 to help farmers improve crop management, Terralynx has since become a trusted partner for across industries. Based in Ontario, Canada, our team’s expertise spans many backgrounds, including agriculture, GIS, aerospace, and technology (hardware and software).